This tutorial is probably also available as a Jupyter notebook in the demo folder in the polymake source and on github.
Different versions of this tutorial: latest release, release 4.13, release 4.12, release 4.11, release 4.10, release 4.9, release 4.8, release 4.7, release 4.6, release 4.5, release 4.4, release 4.3, release 4.2, release 4.1, release 4.0, release 3.6, nightly master
Introduction to topaz
This tutorial tries to give the user a first idea about the features of the topaz application of polymake. We take a look at a variety of small examples.
First, we have to make topaz the current application. For this you can either start polymake with the option -A topaz,
polymake -A topaz
or, if you've already started polymake, type
> application 'topaz';
in the polymake shell.
Simplicial complexes
The most important object of the topaz application is the simplicial complex. There are several ways of obtaining one.
From faces
For example, you can specify some faces of the complex. You can pass them as an Array< Set<Int> >, or Array< Array<Int> >:
> # $s = new SimplicialComplex(INPUT_FACES=>[new Set(0), new Set(0,1), new Set(1,2,3)]);
> $s = new SimplicialComplex(INPUT_FACES=>[[0],[0,1],[1,2,3]]);
As you can see, redundancies are allowed – [0] is not a facet of the complex, and thus not necessary for encoding $s. You can compute the inclusion maximal faces like this:
> print $s->FACETS;
{0 1}
{1 2 3}
You can also pass the FACETS to the constructor, but be aware that in that case the vertices must be numbered increasingly starting with 0 and redundancies are prohibited.
Take a look at your complex using
> $s->VISUAL;
For more information on visualizing simplicial complex, see the section below.
polymake can compute the Hasse diagram of a simplicial complex (watch out, this gets really large for large complexes!). To print all the faces of the complex together with their rank in the face lattice, do this:
> print $s->HASSE_DIAGRAM->DECORATION;
({-1} 4)
({0 1} 2)
({1 2 3} 3)
({0} 1)
({1} 1)
({1 2} 2)
({1 3} 2)
({2 3} 2)
({} 0)
({2} 1)
({3} 1)
The first entry of each pair denotes the face, the second is the rank. The {-1}-node is a dummy representing the whole complex. the {}-node is the empty face. If you want to look at a pretty graph representation, try the visualization:
> $s->VISUAL_FACE_LATTICE;
Using clients
There are several clients that construct common simplicial complexes (for a comprehensive list, see the topaz documentation). An example is the torus client:
> $t = torus();
Of course, polymake can compute the reduced integer homology groups of a simplicial complex, so we can convice ourselves this is a torus:
> print $t->MANIFOLD;
true
> print $t->HOMOLOGY;
({} 0)
({} 2)
({} 1)
The i-th line represents the $i$-th homology module. The curly braces contain torsion coefficients with multiplicity, the second pair entry denotes the Betti number. The empty curly braces indicate that $t is torsion-free. You can see a non-empty torsion group here (using the rows_numbered client for a pretty print with the corresponding dimensions):
> print rows_numbered( real_projective_plane()->HOMOLOGY );
0:{} 0
1:{(2 1)} 0
2:{} 0
As expected, the first homology group has torsion coefficient 2 with multiplicity 1 and all Betti numbers are zero.
As boundary complex
If your complex is a pseudo-manifold, you can obtain a new complex from its boundary. For example, this produces a triangulation of the $2$-sphere:
> $bs = simplex(3)->BOUNDARY;
> print $bs->SPHERE;
true
Triangulating polytopes
The triangulation of a polytope is a simplicial complex, too. The TRIANGULATION gets stored in a property of the polytope. We use the cube client from the polytope application to demonstrate:
> $c = polytope::cube(3);
> $tc = $c->TRIANGULATION;
> print $tc->FACETS;
{0 1 2 4}
{1 2 3 4}
{1 3 4 5}
{2 3 4 6}
{3 4 5 6}
{3 5 6 7}
Geometric realizations
The topaz application is primarily designed to deal with abstract simplicial complexes that do not come with coordinates for an embedding in euclidean space. There is a special object subtype named GeometricSimplicialComplex that has extra properties for dealing with coodinates.
You can pass the coordinates to the constructor. Take care to choose an embedding without crossings!
> $s = new GeometricSimplicialComplex(INPUT_FACES=>[[0],[0,1],[1,2,3]], COORDINATES=>[[1,0],[1,1],[0,2],[2,2]]);
Some clients produce complexes with geometric realization…
> $b = ball(3);
> # print a dense representation of the sparse matrix
> print dense( $b->COORDINATES );
0 0 0
1 0 0
0 1 0
0 0 1
…some others provide the option geometric_realization so you can decide whether to invest the extra computing time.
> $bs = barycentric_subdivision($b,geometric_realization=>1);
Again, see the topaz documentation for a comprehensive list.
Visualization
Visualization of simplicial complexes uses the VISUAL property. Check out
> help 'objects/SimplicialComplex/methods/Visualization/VISUAL';
VISUAL(Options) -> Visual::SimplicialComplex

 Visualizes the complex.

 If __G_DIM__ < 4, the __GRAPH__ and the facets
 are visualized using the __COORDINATES__.

 Otherwise, the spring embedder and the __GRAPH__ are used to
 produce coordinates for the visualization.

 If __JavaView__ is used to visualize the complex, all faces of
 one facet build a geometry in the jvx-file, so you may use
 __Method -> Effect -> Explode Group of Geometries__ in the JavaView menu.

Options:
  __mixed_graph__ => Bool use the __MIXED_GRAPH__ for the spring embedder
  __seed__ => Int random seed value for the string embedder

Options:  Attributes modifying the appearance of filled polygons.
  __FacetColor__ => Color filling color of the polygon
  __FacetTransparency__ => Float transparency factor of the polygon between 0 (opaque) and 1 (completely translucent)
  __FacetStyle__ => String if set to "hidden", the inner area of the polygon is not rendered
  __EdgeColor__ => Color color of the boundary lines
  __EdgeThickness__ => Float scaling factor for the thickness of the boundary lines
  __EdgeStyle__ => String if set to "hidden", the boundary lines are not rendered
  __Title__ => String the name of the drawing
  __Name__ => String the name of this visual object in the drawing
  __Hidden__ => Bool if set to true, the visual object is not rendered
    (useful for interactive visualization programs allowing for switching details on and off)
  __PointLabels__ => String if set to "hidden", no point labels are displayed
  __VertexLabels__ => String alias for PointLabels
  __PointColor__ => Flexible<Color> color of the spheres or rectangles representing the points
  __VertexColor__ => Flexible<Color> alias for PointColor
  __PointThickness__ => Flexible<Float> scaling factor for the size of the spheres or rectangles representing the points
  __VertexThickness__ => Flexible<Float> alias for PointThickness
  __PointBorderColor__ => Flexible<Color> color of the border line of rectangles representing the points
  __VertexBorderColor__ => Flexible<Float> alias for PointBorderColor
  __PointBorderThickness__ => Flexible<Float> scaling factor for the thickness of the border line of rectangles representing the points
  __VertexBorderThickness__ => Flexible<Float> alias for PointBorderThickness
  __PointStyle__ => Flexible<String> if set to "hidden", neither point nor its label is rendered
  __VertexStyle__ => Flexible<String> alias for PointStyle
  __ViewPoint__ => Vector<Float> ViewPoint for Sketch visualization
  __ViewDirection__ => Vector<Float> ViewDirection for Sketch visualization
  __ViewUp__ => Vector<Float> ViewUp for Sketch visualization
  __Scale__ => Float scale for Sketch visualization
  __LabelAlignment__ => Flexible<String> Defines the alignment of the vertex labels: left, right or center

Options:  Attributes modifying the appearance of graphs
  __Coord__ => Matrix<Float> 2-d or 3-d coordinates of the nodes.
    If not specified, a random embedding is generated using a pseudo-physical spring model
  __NodeColor__ => Flexible<RGB> alias for PointColor
  __NodeThickness__ => Flexible<Float> alias for PointThickness
  __NodeBorderColor__ => Flexible<RGB> alias for PointBorderColor
  __NodeBorderThickness__ => Flexible<Float> alias for PointBorderThickness
  __NodeStyle__ => Flexible<String> alias for PointStyle
  __NodeLabels__ => String alias for PointLabels
  __ArrowStyle__ => Flexible<Int> How to draw directed edges: 0 (like undirected), 1 (with an arrow pointing towards the edge),
    or -1 (with an arrow pointing against the edge).  Default is 1 for directed graphs and lattices.
  __EdgeColor__ => Flexible<Color> color of the lines representing the edges
  __EdgeThickness__ => Flexible<Float> scaling factor for the thickness of the lines representing the edges
  __EdgeLabels__ => EdgeMap<String> textual labels to be placed along the edges
  __EdgeStyle__ => Flexible<String> if set to "hidden", neither the edge nor its label is rendered
  __Title__ => String the name of the drawing
  __Name__ => String the name of this visual object in the drawing
  __Hidden__ => Bool if set to true, the visual object is not rendered
    (useful for interactive visualization programs allowing for switching details on and off)
  __PointLabels__ => String if set to "hidden", no point labels are displayed
  __VertexLabels__ => String alias for PointLabels
  __PointColor__ => Flexible<Color> color of the spheres or rectangles representing the points
  __VertexColor__ => Flexible<Color> alias for PointColor
  __PointThickness__ => Flexible<Float> scaling factor for the size of the spheres or rectangles representing the points
  __VertexThickness__ => Flexible<Float> alias for PointThickness
  __PointBorderColor__ => Flexible<Color> color of the border line of rectangles representing the points
  __VertexBorderColor__ => Flexible<Float> alias for PointBorderColor
  __PointBorderThickness__ => Flexible<Float> scaling factor for the thickness of the border line of rectangles representing the points
  __VertexBorderThickness__ => Flexible<Float> alias for PointBorderThickness
  __PointStyle__ => Flexible<String> if set to "hidden", neither point nor its label is rendered
  __VertexStyle__ => Flexible<String> alias for PointStyle
  __ViewPoint__ => Vector<Float> ViewPoint for Sketch visualization
  __ViewDirection__ => Vector<Float> ViewDirection for Sketch visualization
  __ViewUp__ => Vector<Float> ViewUp for Sketch visualization
  __Scale__ => Float scale for Sketch visualization
  __LabelAlignment__ => Flexible<String> Defines the alignment of the vertex labels: left, right or center

Returns Visual::SimplicialComplex
 for a list of available options and this tutorial for a general intro to visualization in polymake.
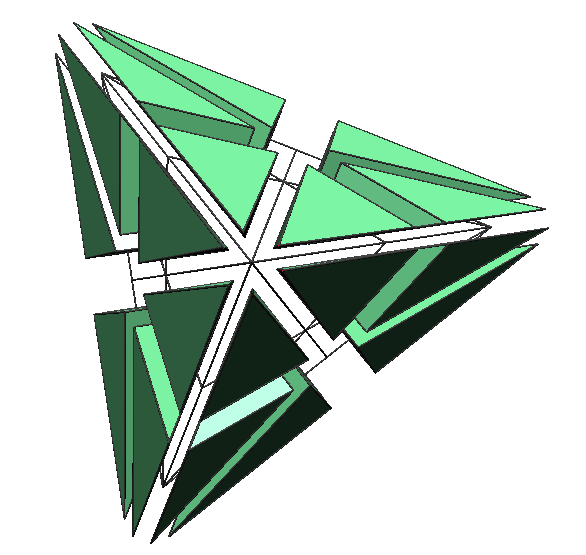
If your complex is of dimension three or lower, you can visualize a geometric realization together with the GRAPH of the complex using the VISUAL property. Note that if your complex is not a GeometricSimplicialComplex, polymake will use the spring embedder to find an embedding of the graph of the complex, which is not guaranteed to result in an intersection-free visualization.
> $bs->VISUAL;
You should give the explode feature of jReality a try – it gives a good (and pretty!) overview of the object. You can find it in the left slot of the jReality interface.

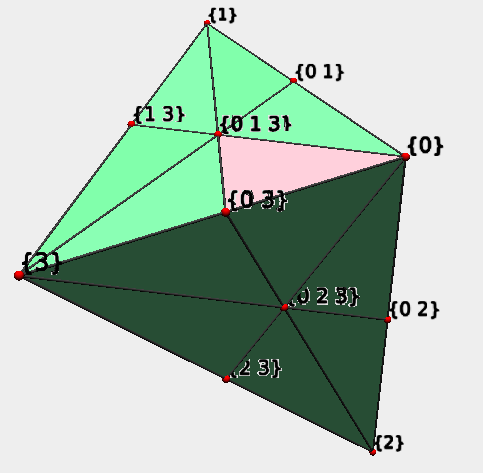
topaz may also visualize distinguished subcomplexes or just sets of faces with different decorations (colors, styles, etc.). For example, to highlight the fourth facet of $bs in pink, do this:
> $a = new Array<Set<Int>>(1); $a->[0] = $bs->FACETS->[4];
> $bs->VISUAL->FACES($a, FacetColor => 'pink');
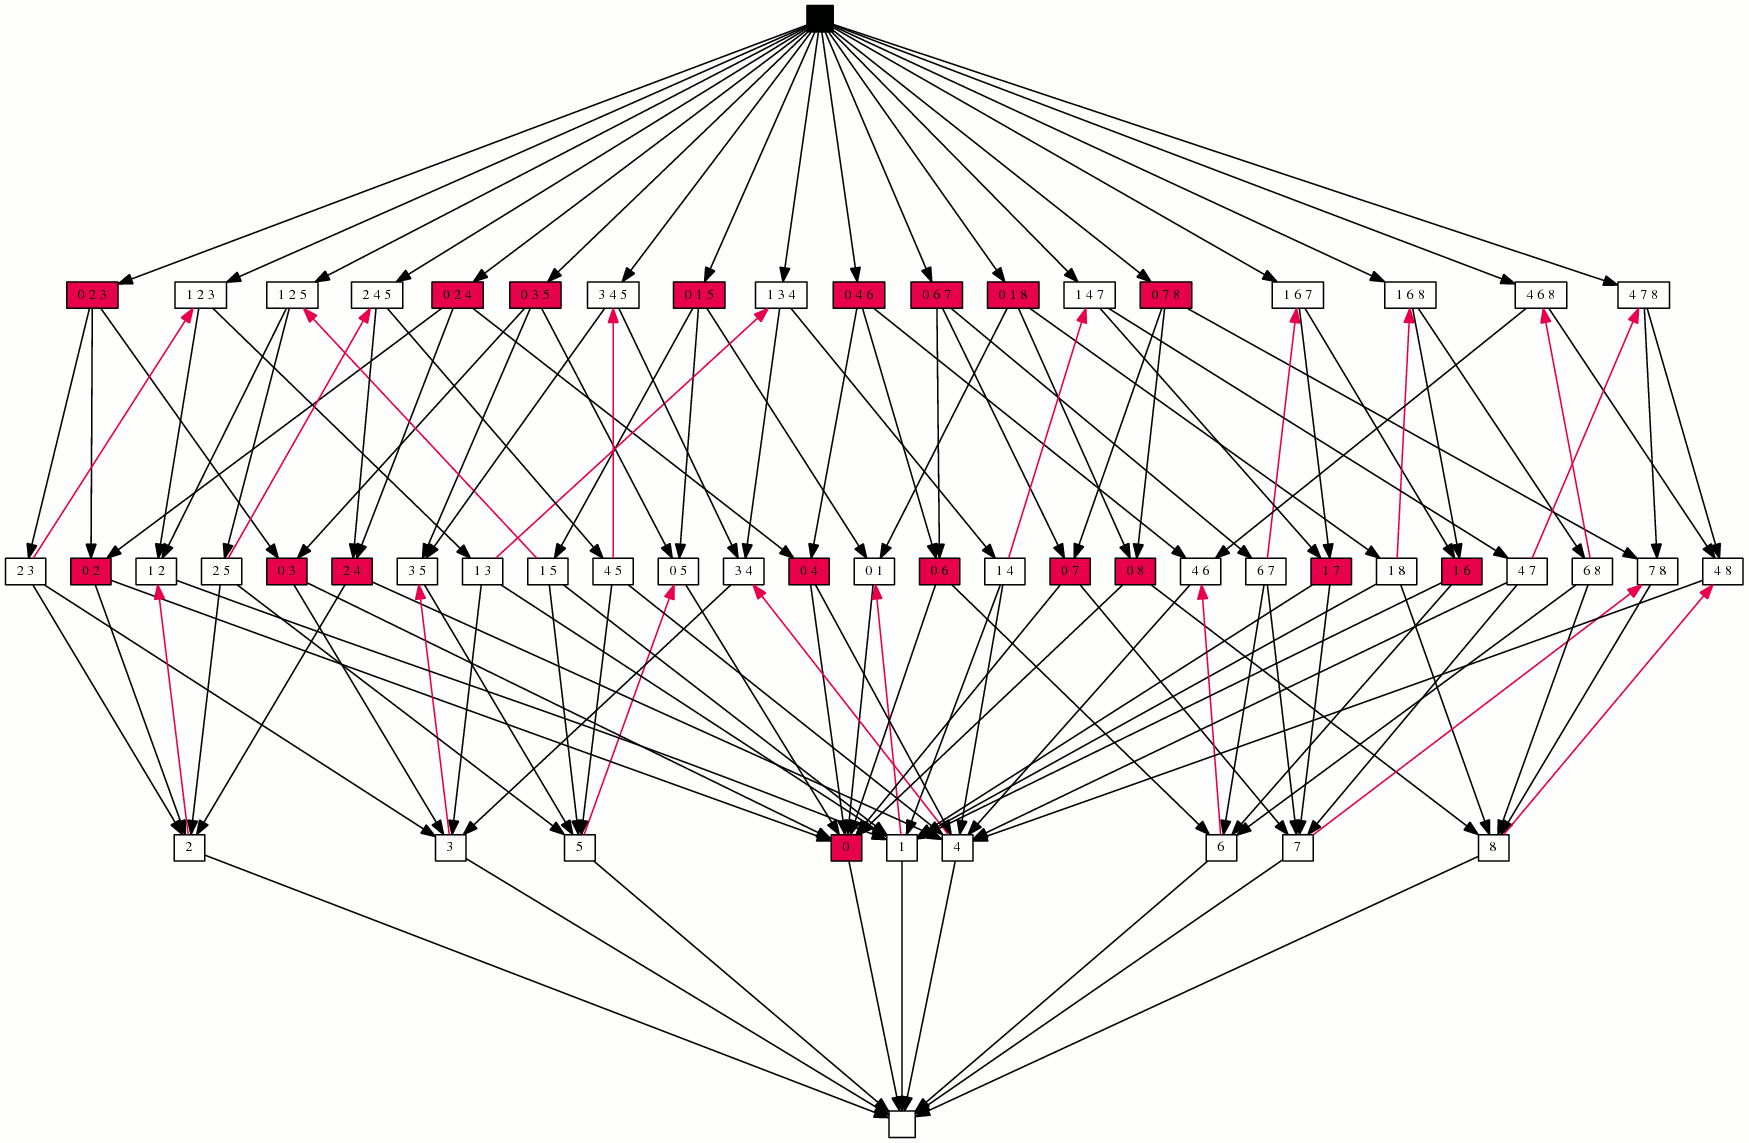
The same can be used for the visualization of the face lattice. As an example, we have a look at a morse matching of the Klein bottle with its associated critical faces. In order to see the arrowheads in the picture clearly, you ought to use graphviz or svg to vizualize it.
> $k =  klein_bottle();
> svg($k->VISUAL_FACE_LATTICE->MORSE_MATCHING->FACES($k->MORSE_MATCHING->CRITICAL_FACES));
 Here the matching of faces is denoted by reversed red arrows and the critical faces are marked red. Check that the graph remains acyclic.
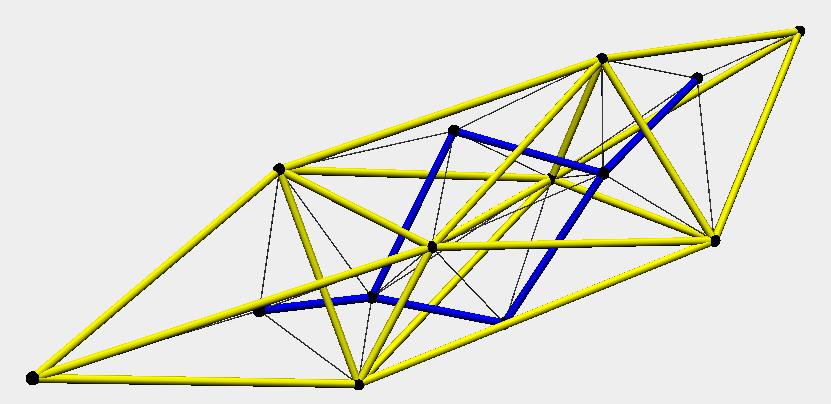
For higher dimensional complexes that cannot be visualized in 3D, you can still have a look at the graphs while ignoring any specified coordinates by using VISUAL_GRAPH, VISUAL_DUAL_GRAPH, or VISUAL_MIXED_GRAPH. An easy example:
> polytope::cube(3)->TRIANGULATION->VISUAL_MIXED_GRAPH;
shows the primal and dual graph of the polytope together with an edge between a primal and a dual node iff the primal node represents a vertex of the corresponding facet of the dual node.
Visualization of the HASSE_DIAGRAM is possible via VISUAL_FACE_LATTICE. It renders the graph in a .pdf file. You can even pipe the tikz code to whatever location using the tikz client:
tikz($s->VISUAL_FACE_LATTICE, File=>"/path/to/file.tikz");
